Your internet fails at 9 PM.
A speed test at 2 PM won't catch it.
NetworkTests Monitor watches your connection every second, around the clock — and when something breaks, it tells you in plain English where the problem starts: your Wi-Fi, your router, your ISP, your computer — or the app you're using.
NetworkTests Monitor runs on macOS, Windows and Linux computers. Open this page on your computer to download it.
macOS

brew install networktests/tap/networktests-monitorWindows


Clear diagnoses, not just charts
The product's voice is the verdict banner. Real examples of what Monitor concludes on its own:
How it works
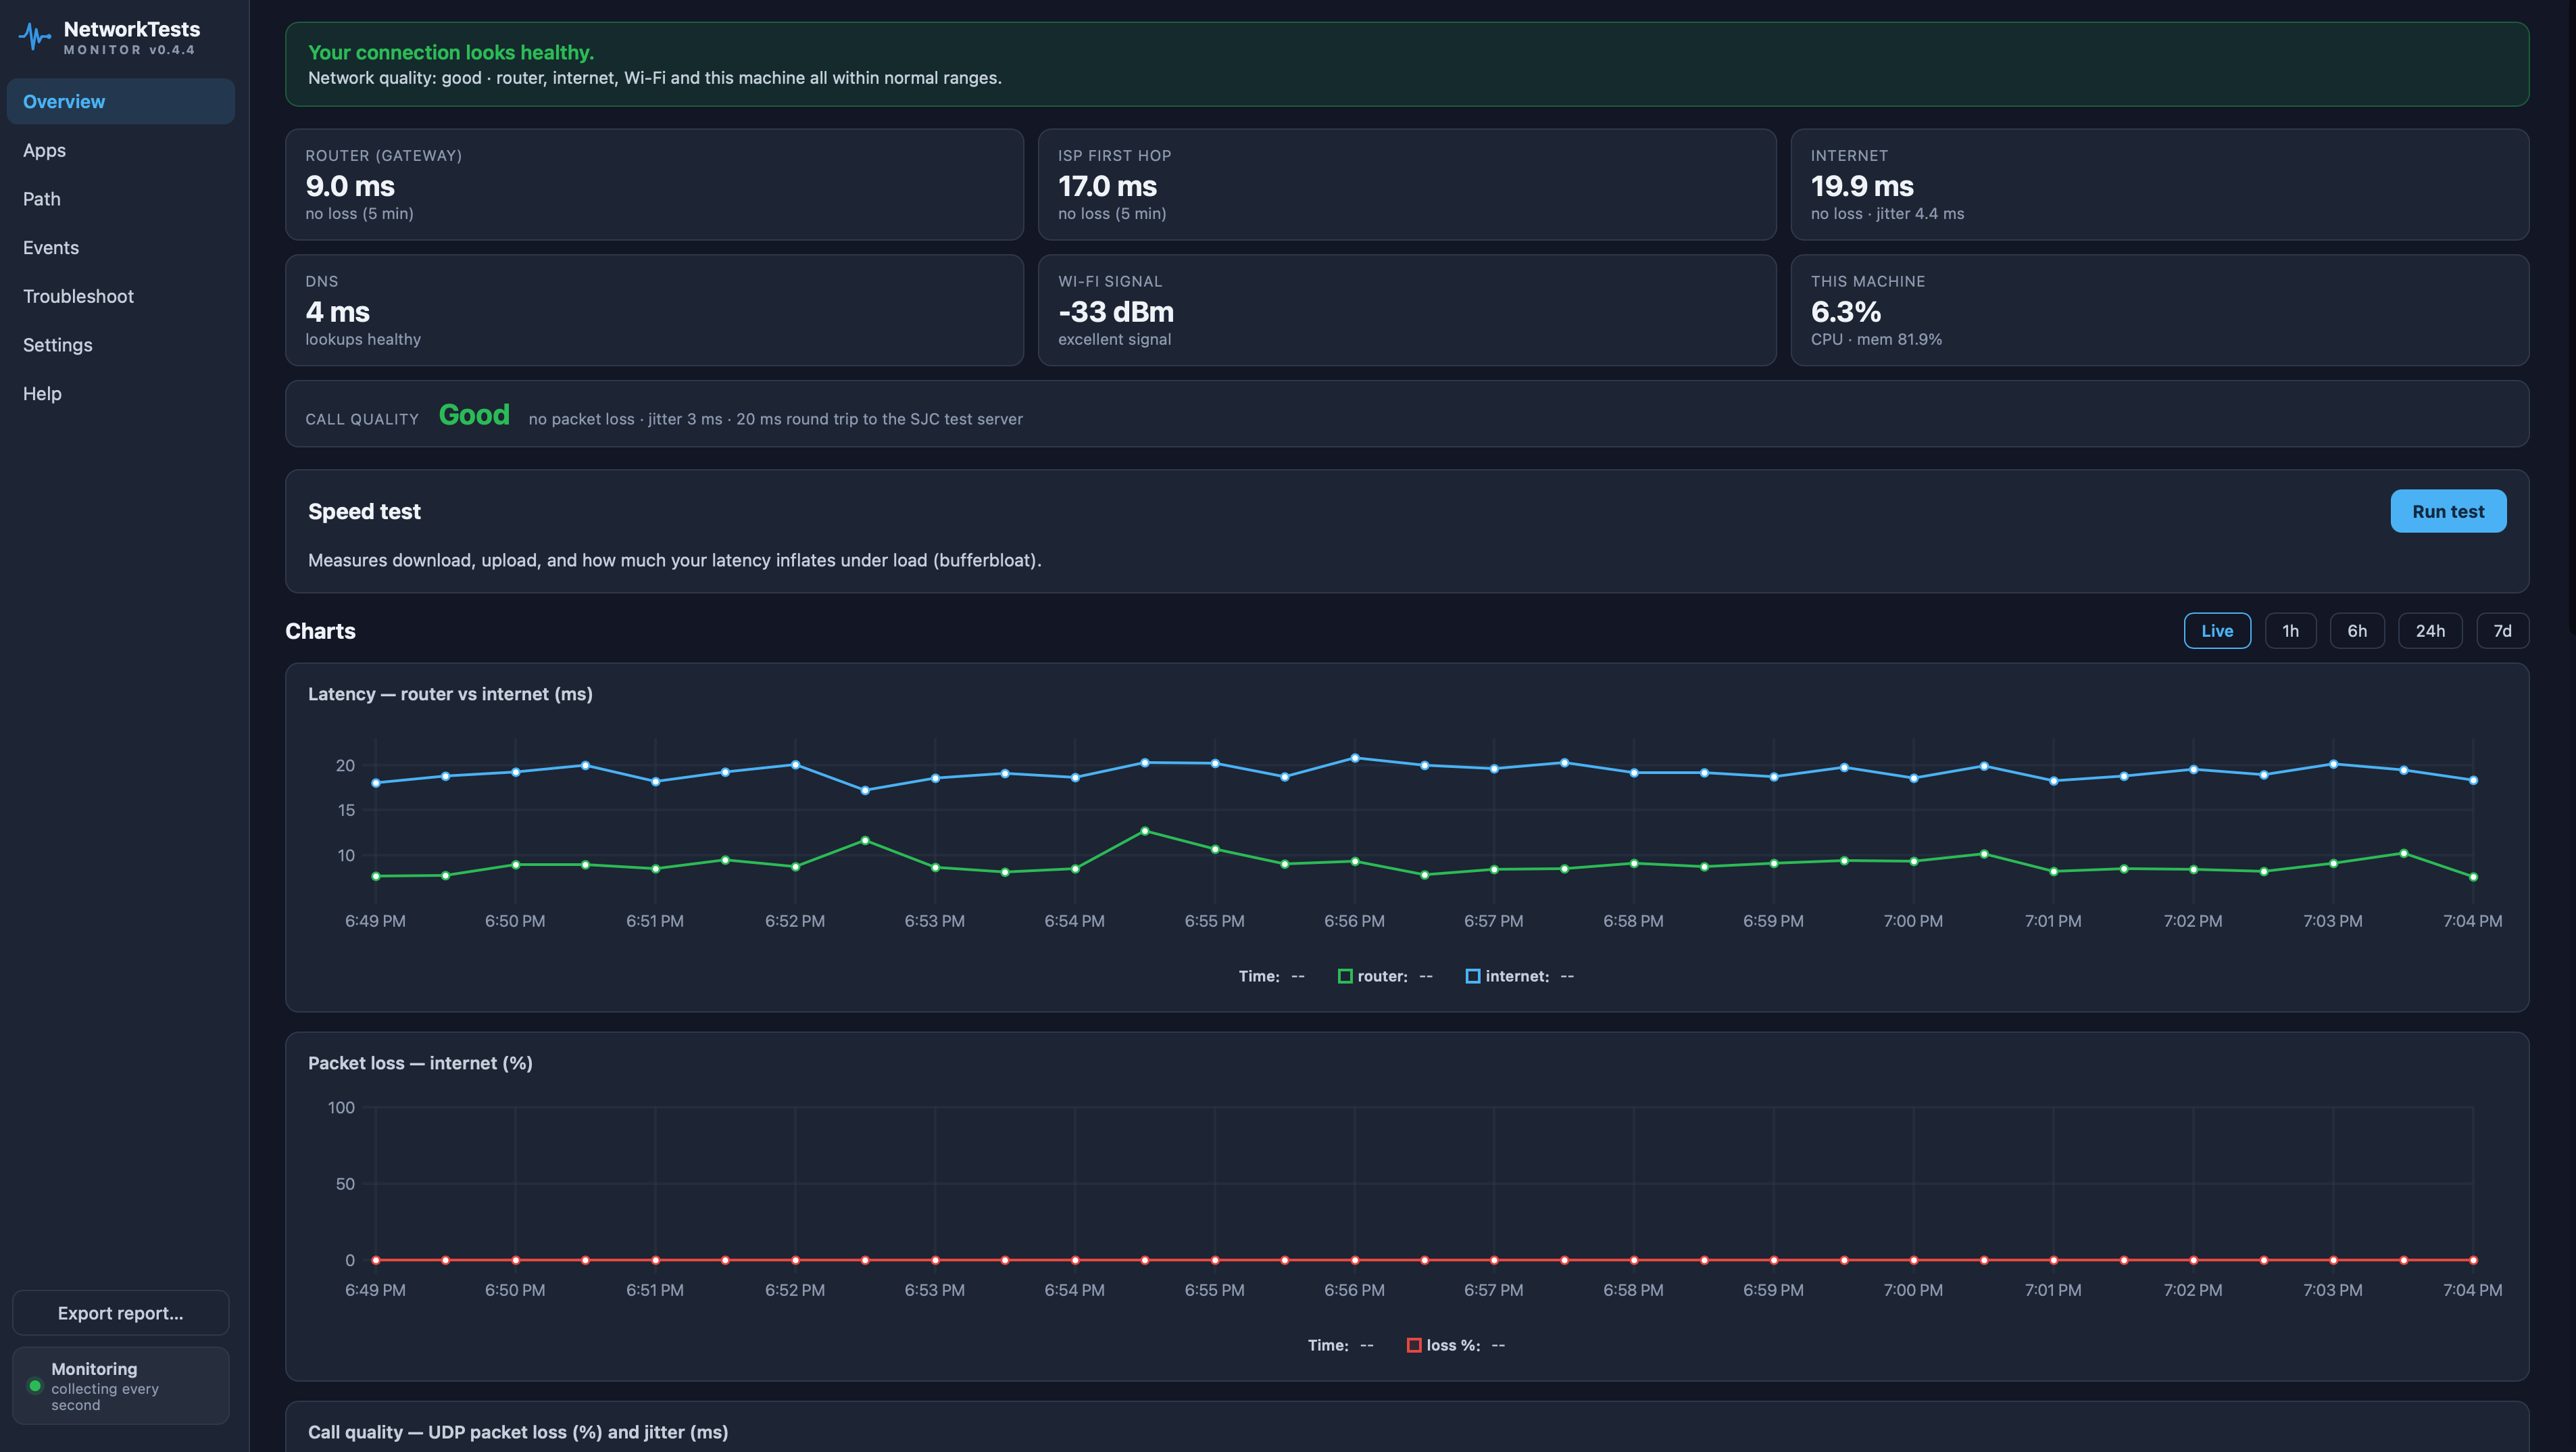
Monitor measures each part of your connection independently and continuously — most of it every second — then correlates the results to pinpoint where performance starts to degrade.
What it watches — every second
A speed test is one snapshot of one metric. Monitor measures every stage of your connection independently and continuously, so intermittent problems can't hide.
Router vs. ISP vs. Wi-Fi vs. your machine
Per-second probes to your router, your ISP's first visible hop, and three independent internet anchors. When loss appears, the pattern points at where it starts — and the app says it in words, not graphs you have to interpret.
Will your calls hold up? Measured, not guessed
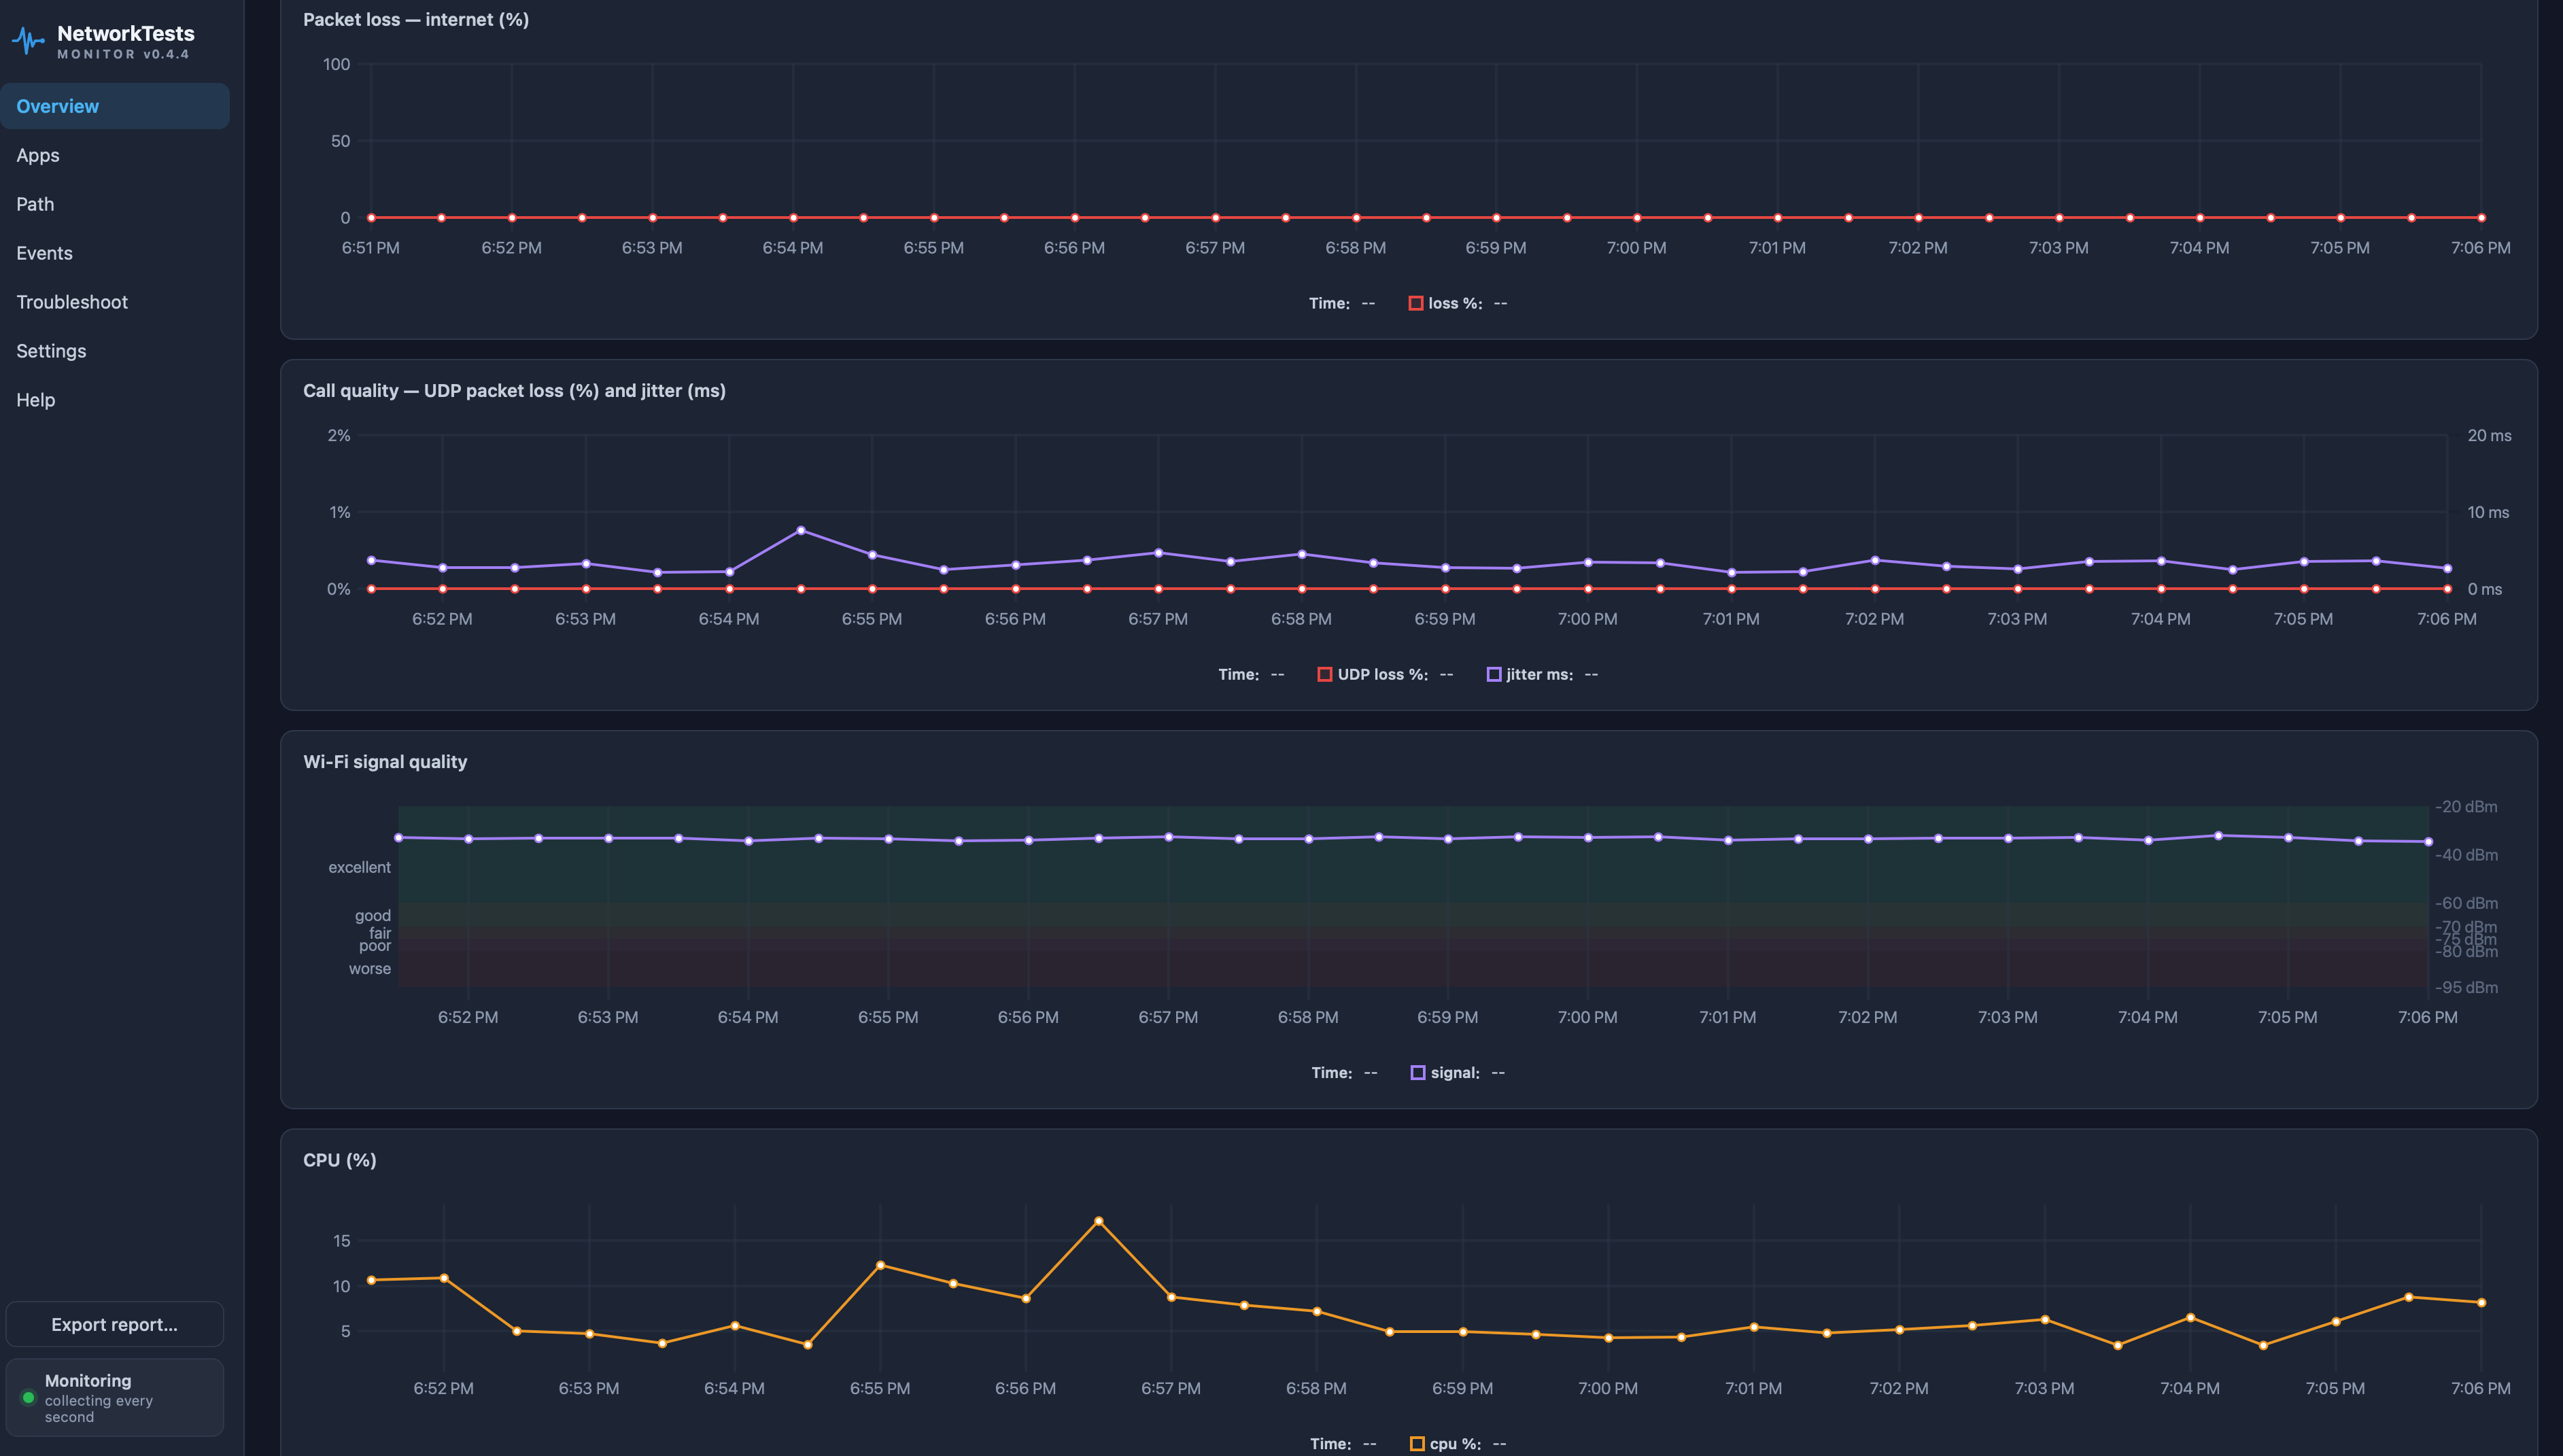
Every second, Monitor sends a small UDP packet — the kind of traffic video calls and games use — to the nearest test server and times the round trip. The Overview grades call quality Good, Fair or Poor from packet loss and jitter, at levels you'd actually notice on a call, and charts it over time so a problem from earlier in the day is still there to see.
Cross-validated packet-loss detection
Internet loss counts only when all three anchors (Google, Cloudflare, Quad9) lose packets and a connection check confirms it, so a single service rate-limiting pings can't invent an outage. A router that filters probes is reported as filtering, not failing.
Monitor the apps you actually use
One click adds Zoom, Teams, Slack, Microsoft 365, Outlook, Salesforce, Google Meet or GitHub — or any host of yours (up to 30). Each gets a learned response-time baseline, a health rank, and a DNS / TCP / TLS / server-wait / transfer timing breakdown.
Why isn't this website working? Ask it
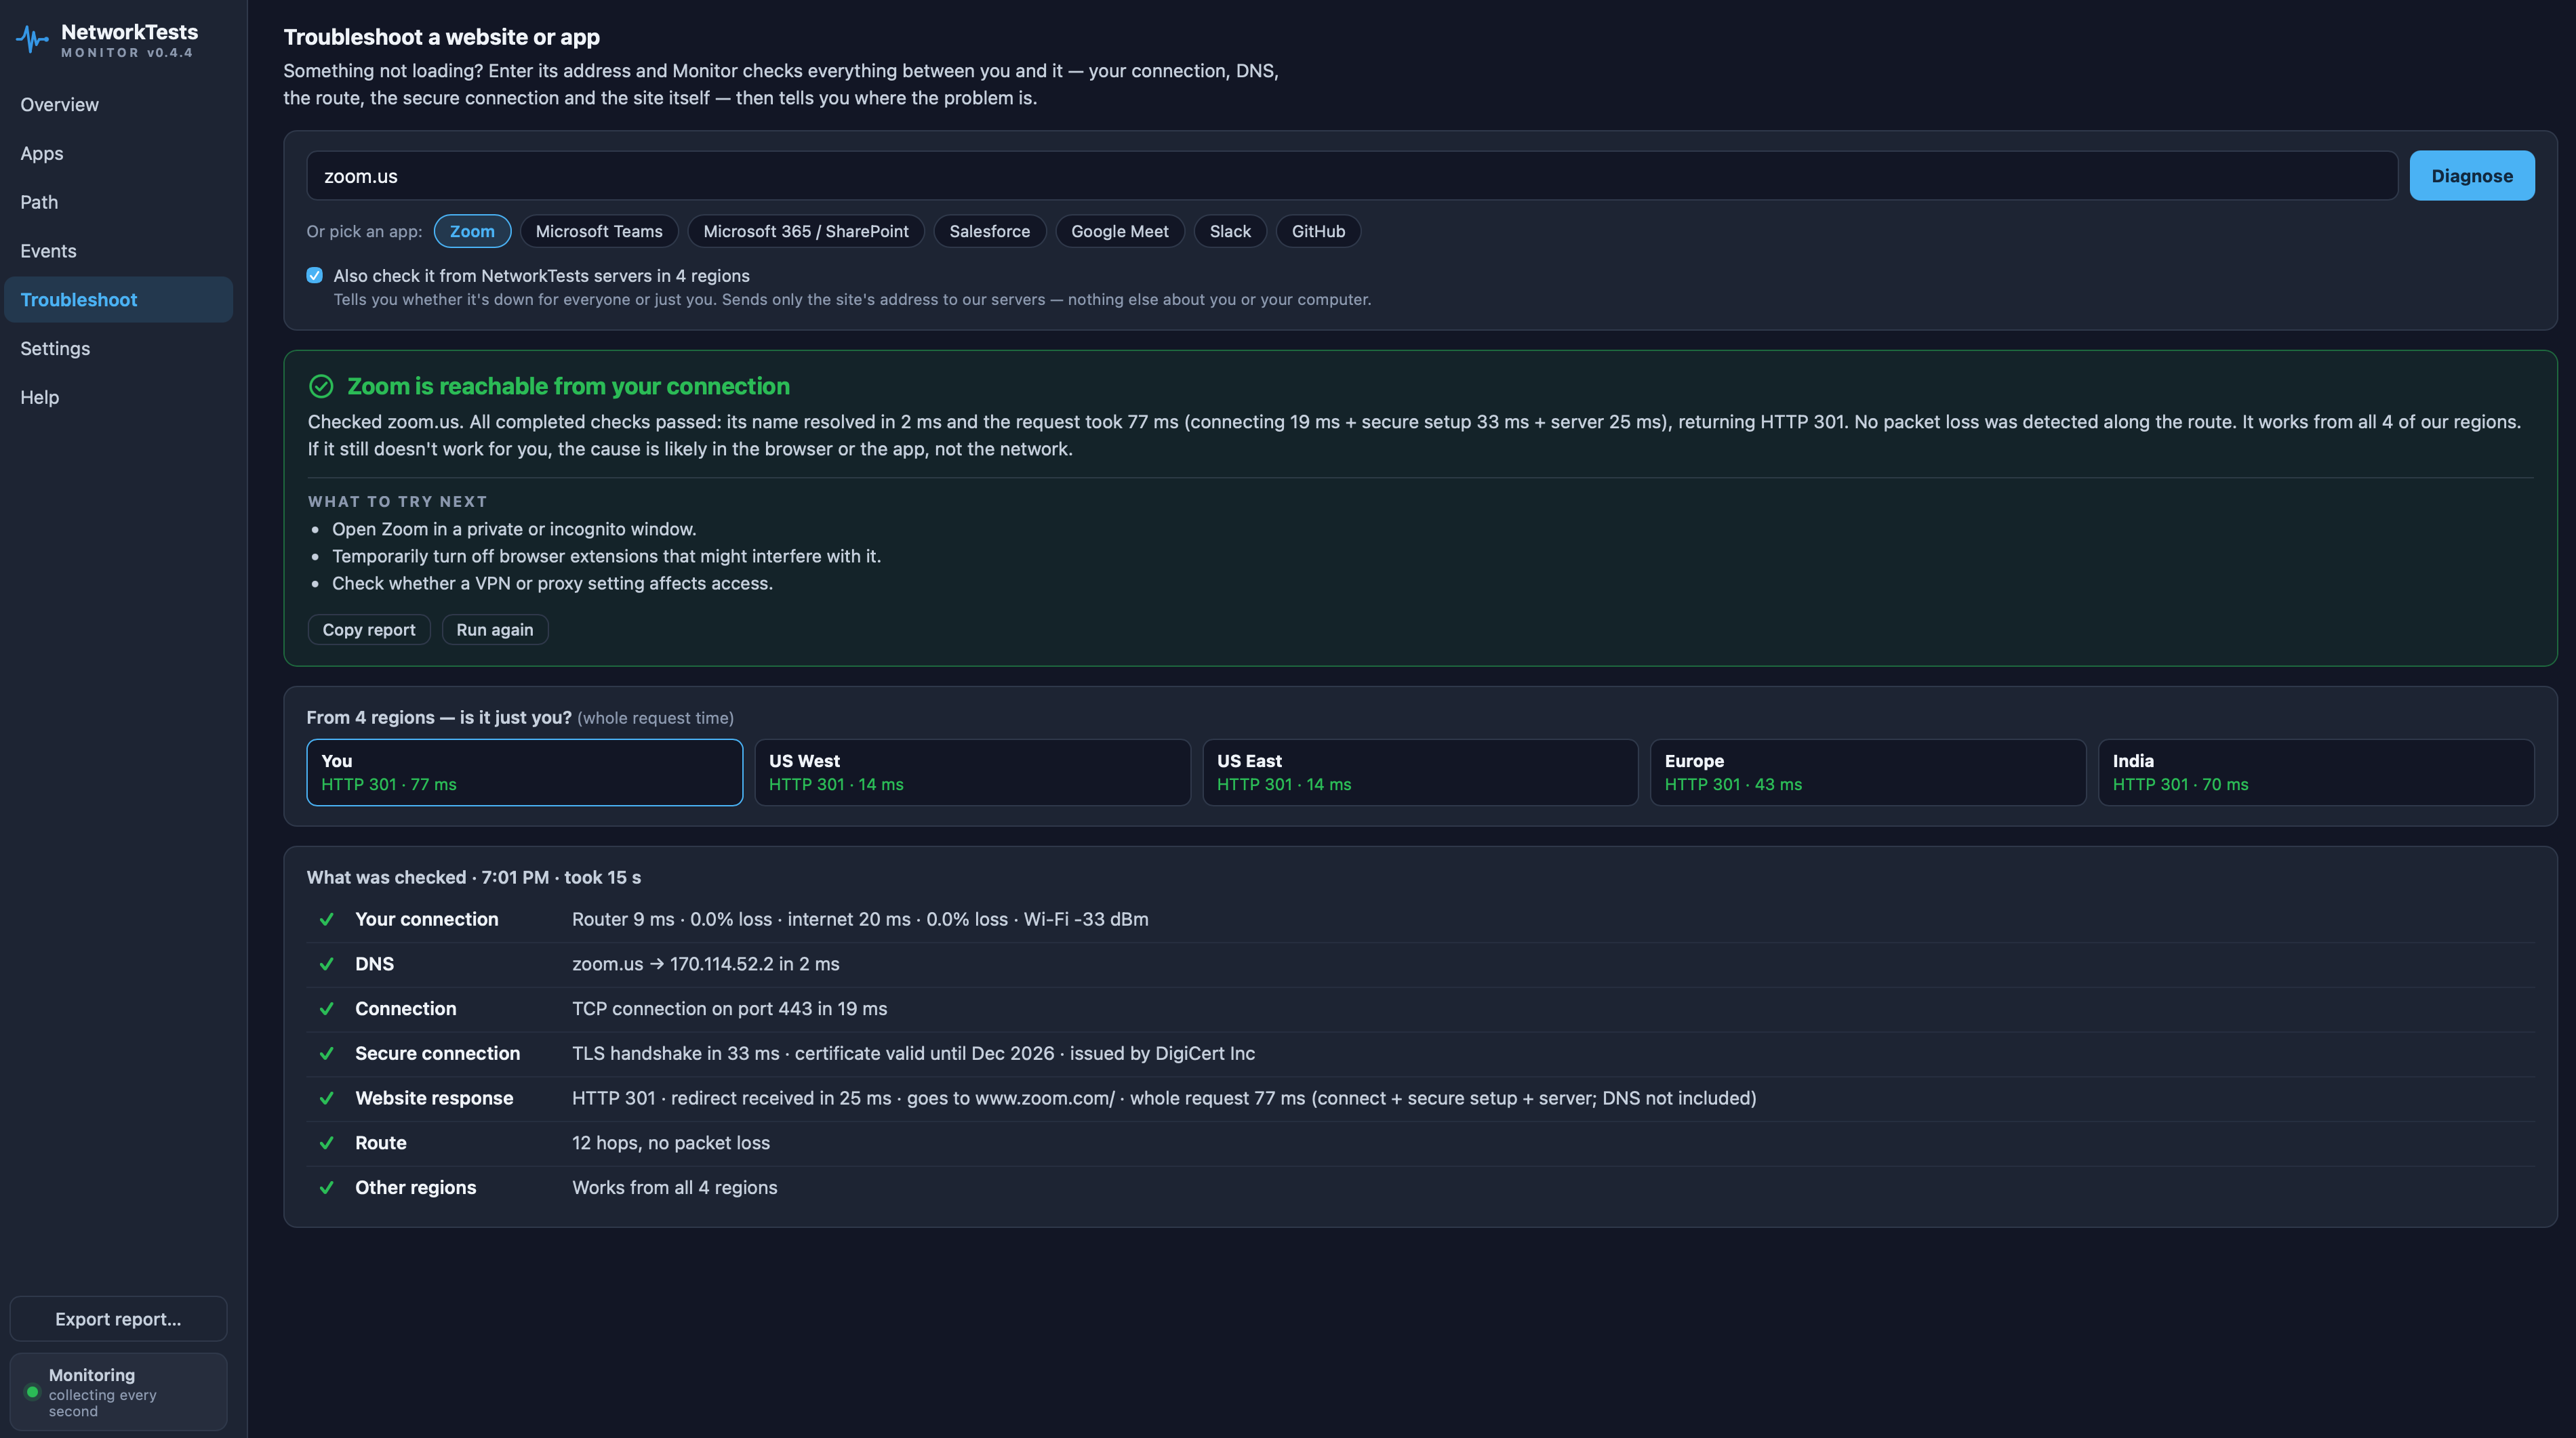
Type a website, an address or an app — or click Troubleshoot on any app card — and in about 15 seconds Monitor checks everything between you and it: your own connection, DNS, the route, the secure connection and the site itself. You get one plain-English answer with what to try next: your Wi-Fi, a DNS filter, loss inside your ISP, a slow server, an expired certificate. Tick one box and our servers in four regions check it too, so you know whether it's just you — or failing from our four regions as well.
Notifications only when it means something
One slow app is usually that app's own problem, so it stays on the Apps page — no banner, no notification. When several slow down together, Monitor works out what they share — a saturated link, DNS, Wi-Fi, this computer — and names it. If your connection checks out clean, it says so instead of blaming it. Real network faults, like an outage or packet loss, notify you directly.
Hop-by-hop, like MTR — without installing MTR
Continuous traces to Google and Cloudflare out of the box, plus up to three destinations of your own (ICMP; UDP also on macOS). Per-hop latency and loss over any window from 5 minutes to 7 days.
Signal strength and machine pressure, correlated
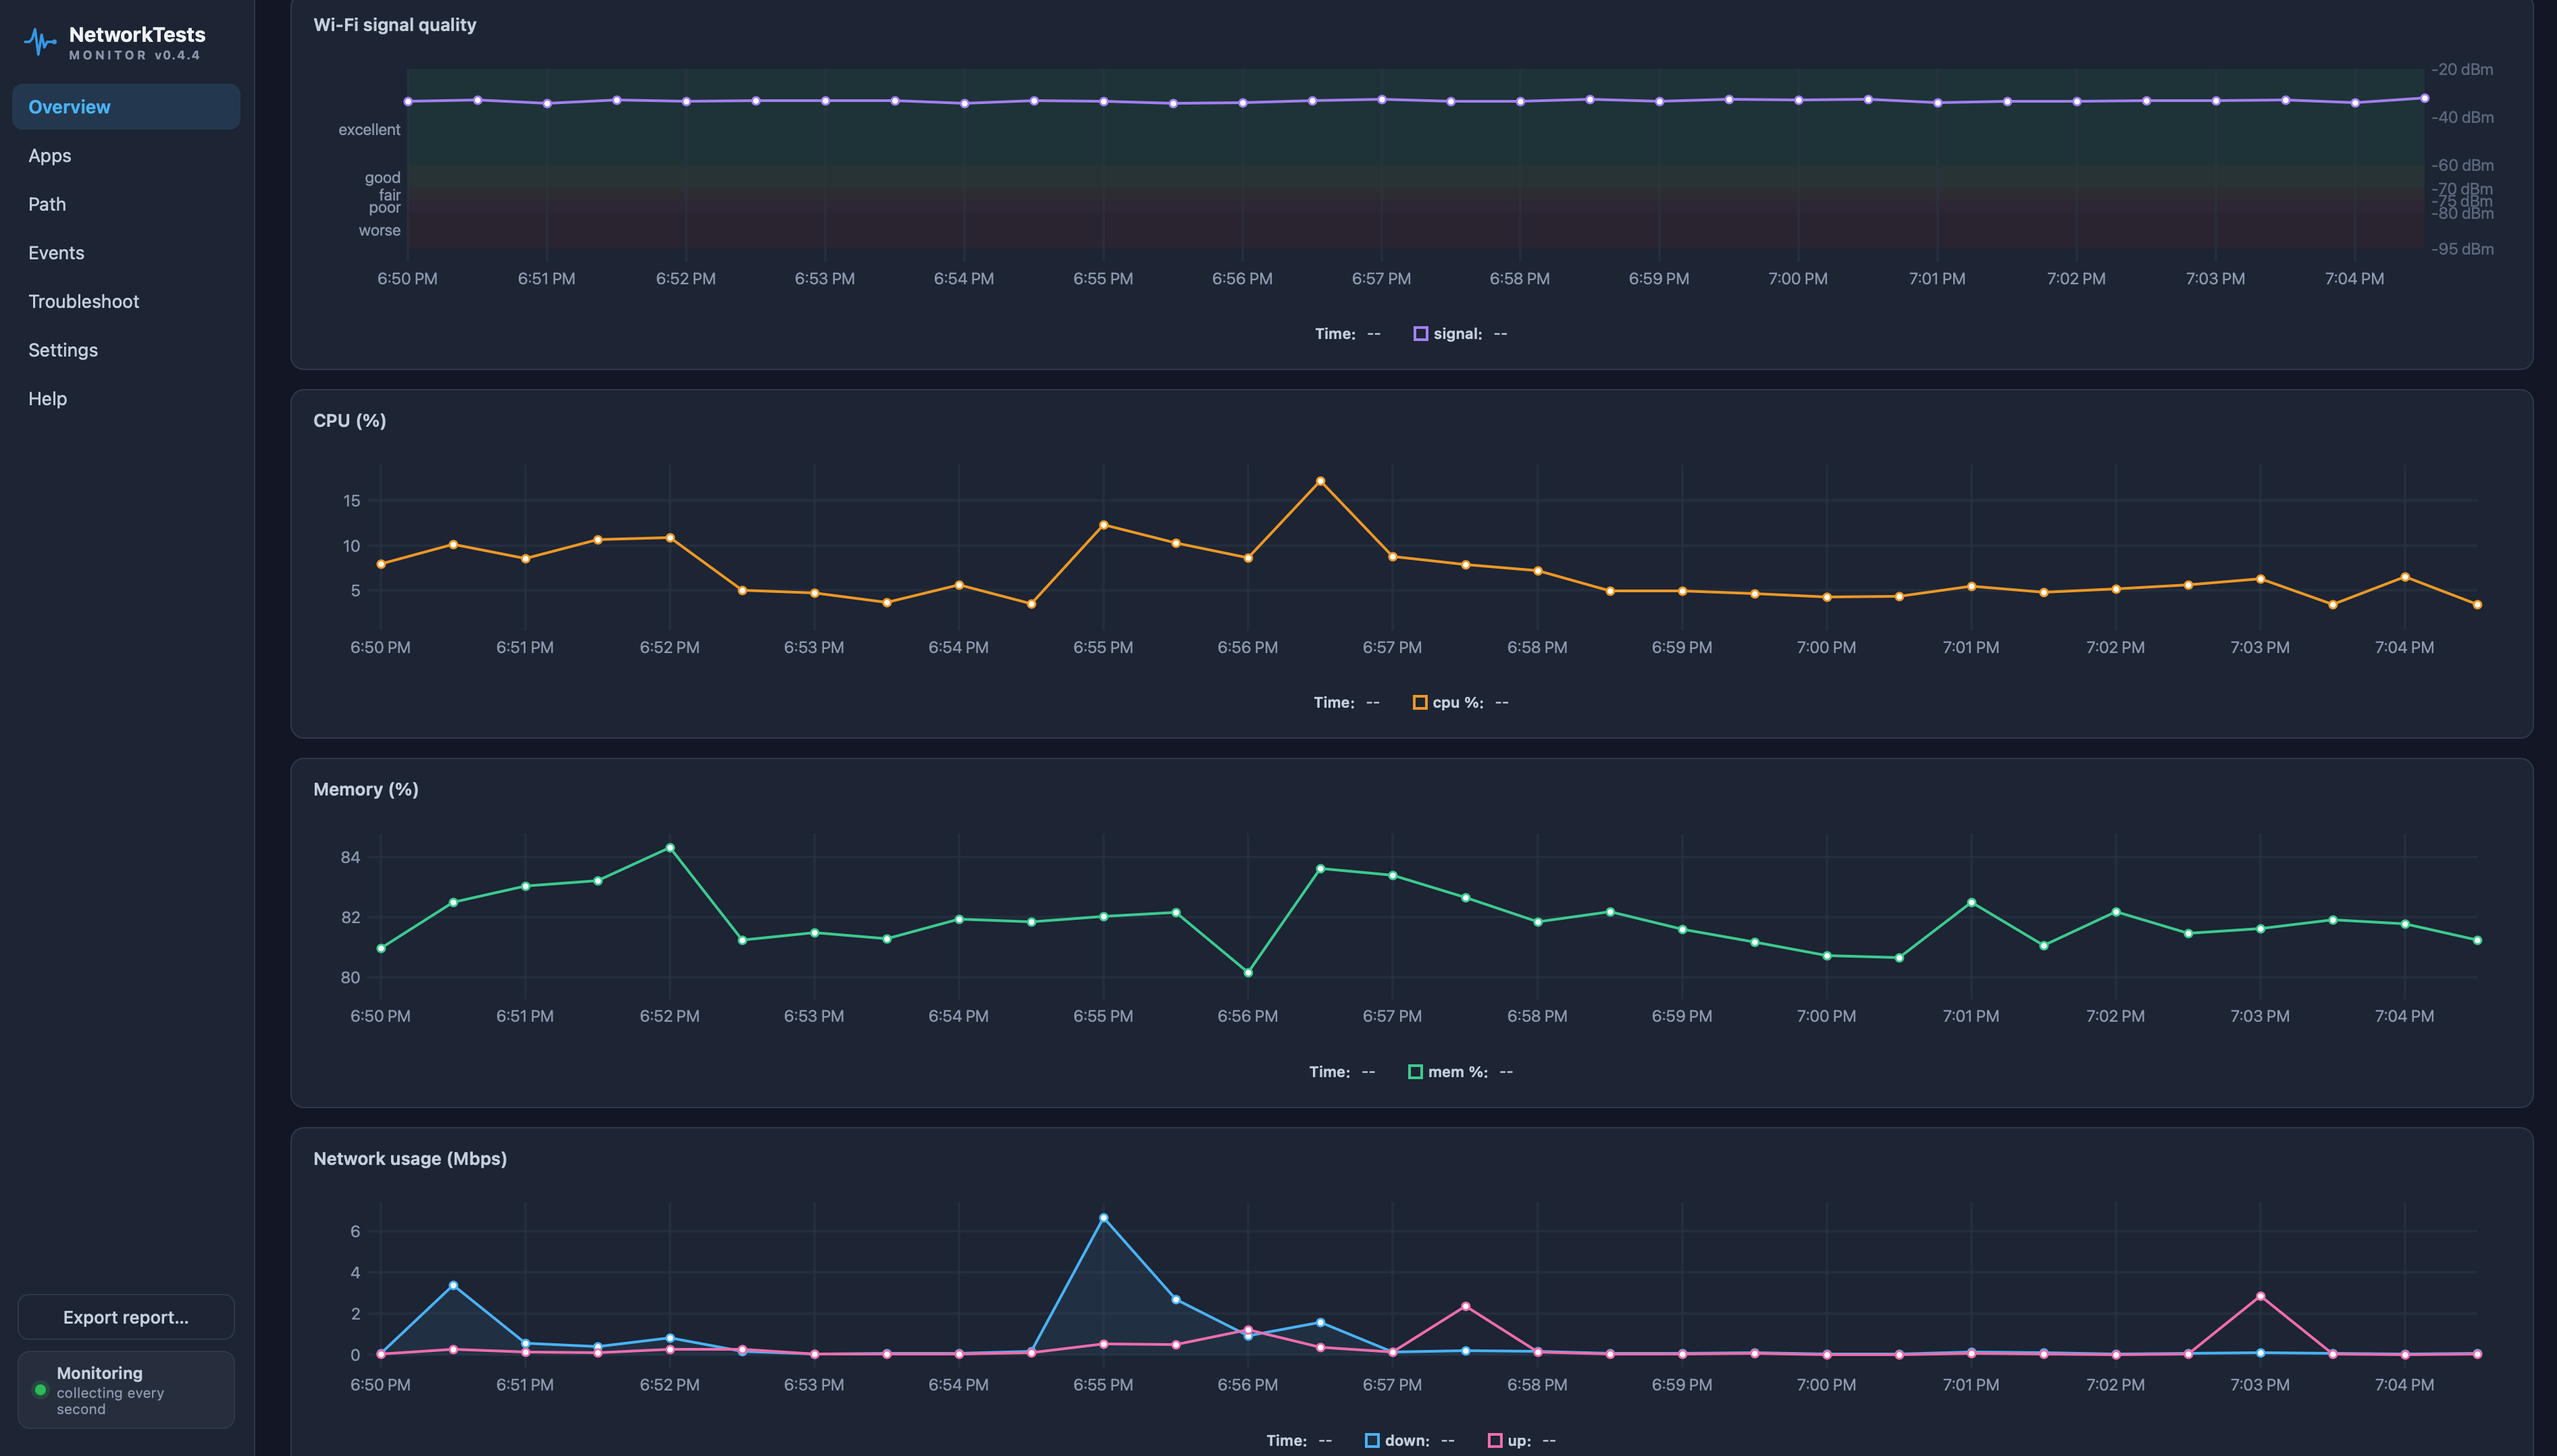
Wi-Fi signal is tracked alongside everything else — and so are CPU and memory, because a laptop at 100% CPU can degrade packet processing all by itself. Monitor correlates system pressure with network degradation — and blames the machine when it's the machine.
Speed tests that measure latency under load
On-demand and twice-daily automatic tests measure download, upload — and how much latency rises while the line is busy. When it climbs by 100 ms or more, that's flagged as bufferbloat, with the fix (SQM / Smart Queue) named.
A PDF your ISP can't argue with
Export any window from 5 minutes to 7 days: latency, loss, call-quality, Wi-Fi and system charts, per-app breakdowns, hop tables and the event timeline, with methodology spelled out. See a sample 7-day report (PDF)
Private by architecture
Your network history stays on your computer. Measurements are stored in a local database on your machine — there is no account, no sign-up, and no central dashboard your data is sent to. Monitor generates only the network traffic required for its monitoring and diagnostic tests. Your entire history lives in one local folder, and you decide when to export a report and who sees it.
Requirements
| Platform | Needs | Notes |
|---|---|---|
| macOS | macOS 12 or newer, Apple Silicon or Intel | Signed & notarized. Lives in the menu bar; PDF export uses your installed Chrome if present (HTML otherwise). Also on the Mac App Store (macOS 13+), which keeps it updated for you. |
| Windows | Windows 10 or 11, 64-bit | Signed installer; runs in the system tray (check the ^ overflow — Windows hides new tray icons by default). PDF export uses Edge, which is built in. |
| Linux | Ubuntu 22.04+, Debian 12+ or Fedora · x86_64 or arm64 · with or without a desktop — the installer adds what it needs | With a desktop: the app with a tray icon (GNOME, e.g. Fedora, needs the AppIndicator extension). Without one (Ubuntu Server, Raspberry Pi OS Lite): the same command installs the server edition — a background service with its dashboard in your browser. |
Built for people who need to know why
Home users
"Why does the Wi-Fi get bad every evening — and is it actually the Wi-Fi?"
Remote workers
"Why do my video calls keep freezing when every speed test says my connection is fine?"
Gamers
"Why does my ping spike the moment someone else starts a download?"
IT professionals
"Can I get evidence of whether the problem is inside the home network or upstream?"
Questions
Is it really free?
Yes — NetworkTests Monitor is free for personal use, with no account and nothing behind a subscription. Monitoring your own connection, keeping your own history and exporting your own reports will stay free. A paid edition for businesses is planned — fleet monitoring, central reporting and support for IT teams who need to see every employee's connection, not just their own.
Does Monitor send my data to the cloud?
No — your monitoring history stays on your computer, stored in a local database — there is no account and no central dashboard. Monitor generates only the network traffic required for its monitoring and diagnostic tests, and reports leave your machine only when you export and share one yourself. If you tick “Also check it from NetworkTests servers in 4 regions” on the Troubleshoot page, the address you entered is sent to our servers so they can test it — nothing else about you or your computer.
What exactly does it monitor?
Every second: your router, your ISP's first hop and three independent internet anchors (latency, packet loss, jitter). Alongside those: UDP call quality to the nearest test server, Wi-Fi signal, DNS response times, your machine's CPU and memory, up to 30 applications of your choice with DNS/TCP/TLS/server-wait timing breakdowns, hop-by-hop paths every minute, and speed tests with bufferbloat detection twice a day.
Can it tell me why one website or app isn't working?
Yes — that's what the Troubleshoot page is for. Enter the website, address or app (or click Troubleshoot on an app card). In about 15 seconds Monitor checks your own connection, DNS (yours against Cloudflare's and Google's), the connection and certificate, the site's response and the route, then names the one thing that's wrong — a blocked or failing DNS server, your Wi-Fi, loss inside your ISP, a slow or failing server, an expired certificate, or a device that isn't listening on that port — with what to try next. With “Also check it from NetworkTests servers in 4 regions” ticked, it also shows whether the site works from our servers in US West, US East, Europe and India — strong evidence of whether it's just you; only the address you entered is sent for that, and private addresses never are.
Can I use it while working remotely?
Yes — that's one of its main audiences. Monitor works on home networks and VPN/remote-work setups, and helps distinguish "the app's backend is slow" from "my connection is the problem" — the distinction every remote-work ticket hinges on.
How is this different from the test on networktests.com?
The browser test is a snapshot — great when something is wrong right now. Monitor is for the problems that come and go: it's always measuring, so when your video call stutters at 9:14 PM, the evidence is already recorded, with a clearer picture of where the problem started.
Why does the Windows publisher say "HostAnywhere LLC"?
NetworkTests is built by HostAnywhere LLC, and the installers are signed with its verified certificate — that's the name Windows shows during installation. Same maker, same product.
Will it slow my computer or my network down?
No. Probes are tiny — a few small packets per second — and the app is engineered to stay out of your way, idling at a tiny fraction of your CPU. The only heavier moments are the speed tests you run, or the two automatic ones per day.
Does it work on VPNs and corporate laptops?
Yes — it's VPN-aware. If a VPN client owns your default route, Monitor finds the gateway that actually answers; if your router or VPN filters probes entirely, it says so honestly instead of reporting a fake outage, and internet-path monitoring continues normally.
How do I uninstall?
macOS: if you turned on Start at login, switch it off in Settings, then quit from the menu bar and delete the app from Applications; installed with Homebrew, just run brew uninstall --cask networktests-monitor. Windows: Settings → Apps → NetworkTests Monitor → Uninstall. Linux: run /opt/networktests-monitor/uninstall.sh. Uninstalling keeps your monitoring history; to delete that too, remove the networktests folder — ~/Library/Application Support/networktests on macOS, %APPDATA%\networktests on Windows, ~/.config/networktests on Linux.
Know why your connection slows down.
Start monitoring for free. Build a history of your connection before the next problem happens.
Download NetworkTests Monitor — Free
macOS · Windows · Linux · No account required